I set up a smaller version of my mad-scientist stuff at our cottage on Beaver Island, Michigan (45 38 38 N, 85 29 24 W, grid square EN75gp), to record the RF spectrum before, during, and after the eclipse on August 21, 2017. The recordings were successful, and I captured just under 1 TB (!) of data. Fortunately, disk drives are cheap these days.
I’ve done the very first step of analysis on one of the data sets — a recording of the entire AM broadcast band done with a Red Pitaya SDR. The results are on YouTube at:
This video plays back the 8 hours of recording (1400 – 2200 UTC) in about 3 minutes. It’s built from screenshots taken at 5 second intervals from a Gnuradio flowgraph playing back the data recorded from a Red Pitaya SDR.
Here’s one shot taken about an hour into the recording (e.g., 1500 UTC, 11:00AM EDT):
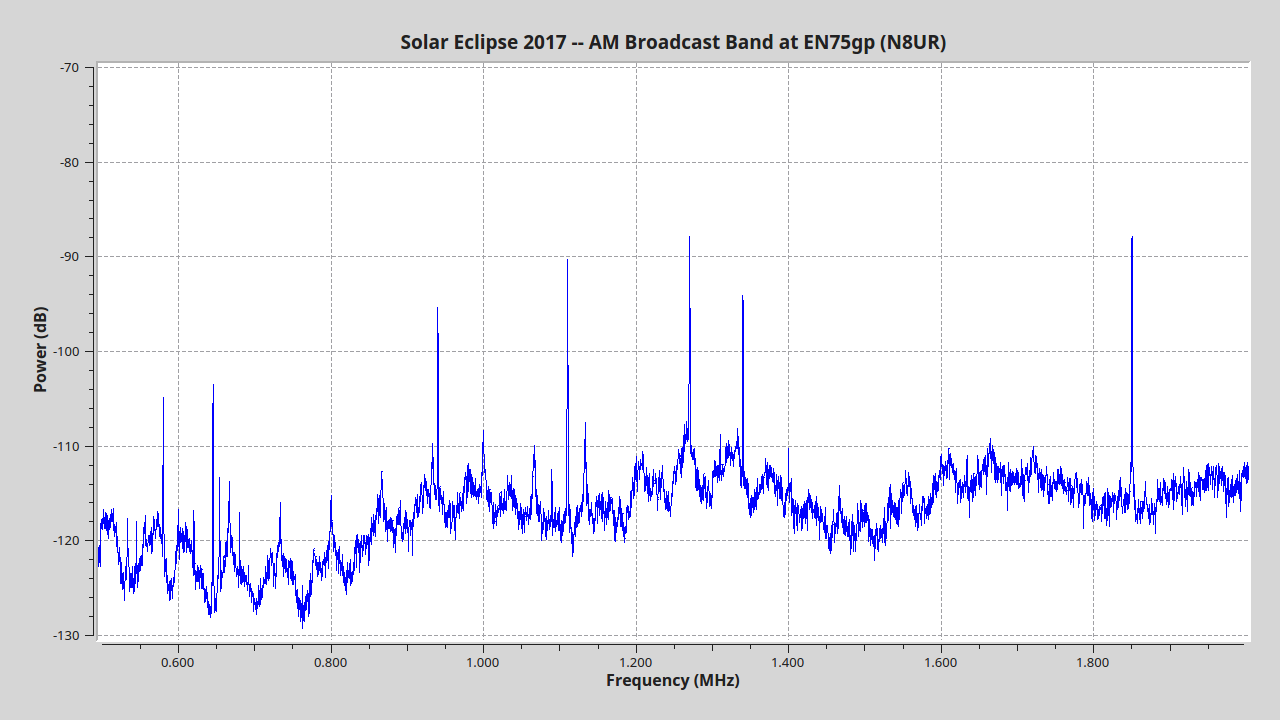
According to Radio Reference, there are 8 “local” AM stations I might hear from this location — the nearest one is 28.1 miles away. This is nice since the spectrum is largely empty and we have a good chance of seeing new stations pop up if the propagation enhances during the eclipse. I see several of the local stations on this plot; I need to dig further to see what’s real and what is spurious before I know for sure just what is there.
For reference, the local stations are:
- 580 kHz WTCM Traverse City, MI (64.5 miles)
- 680 kHz WDBC Escanaba, MI (77.9 miles)
- 750 kHz WARD Petoskey, MI (34.7 miles)
- 940 kHz WIDG Saint Ignace, MI (37.3 miles)
- 1110 kHz WJML Petoskey, MI (34.7 miles)
- 1270 kHz WMKT Charlevoix, MI (28.1 miles)
- 1310 kHz WCCW Traverse City, MI (67.3 miles)
- 1340 kHz WMBN Petoskey, MI (32.6 miles)
Because the Red Pitaya does not have an external frequency reference, I inserted a marker at 1850 kHz created by a signal generator locked to an FTS-4100 cesium atomic frequency standard.
The antenna was an approximately 50 foot sloping wire with the top end attached to my tower at about 40 feet. There were two radials about 50 feet long. The Red Pitaya has a high input impedance and seems very susceptible to local EM noise, so the noise floor in the recordings is not very stable.
1 comment
[…] First data from Solar Eclipse 2017 […]