I’ve continued processing the data generated from software-defined-radio recordings I made during the 2017 solar eclipse at my fairly isolated and low-RF-noise location on Beaver Island, Michigan (45 38 38 N, 85 29 24 W, grid square EN75gp). The nearest AM station is about 28 miles away, so it’s a pretty good site for monitoring the high frequency bands. The data was recorded over the eight hours from 1400 – 2200 UTC (10AM to 6PM EDT) on Monday, August 21, 2017.
I’ve now made movies of my 80M, 40M, 30M, and 20M ham band recordings, using similar methodology to that used for my movie of the AM broadcast band shown in my prior post, and uploaded them to YouTube:
- 80M Playback (~3 minutes) https://youtu.be/GtPiAjpgHac
- 40M Playback (~3 minutes) https://youtu.be/Bgvz9Wk9cUM
- 30M Playback (~3 minutes) https://youtu.be/OAxZmbrNQMM
- 20M Playback (~3 minutes) https://youtu.be/7FzoL4jitNs
Here’s a randomly chosen frame from the 80 meter recording, captured during the eclipse period:
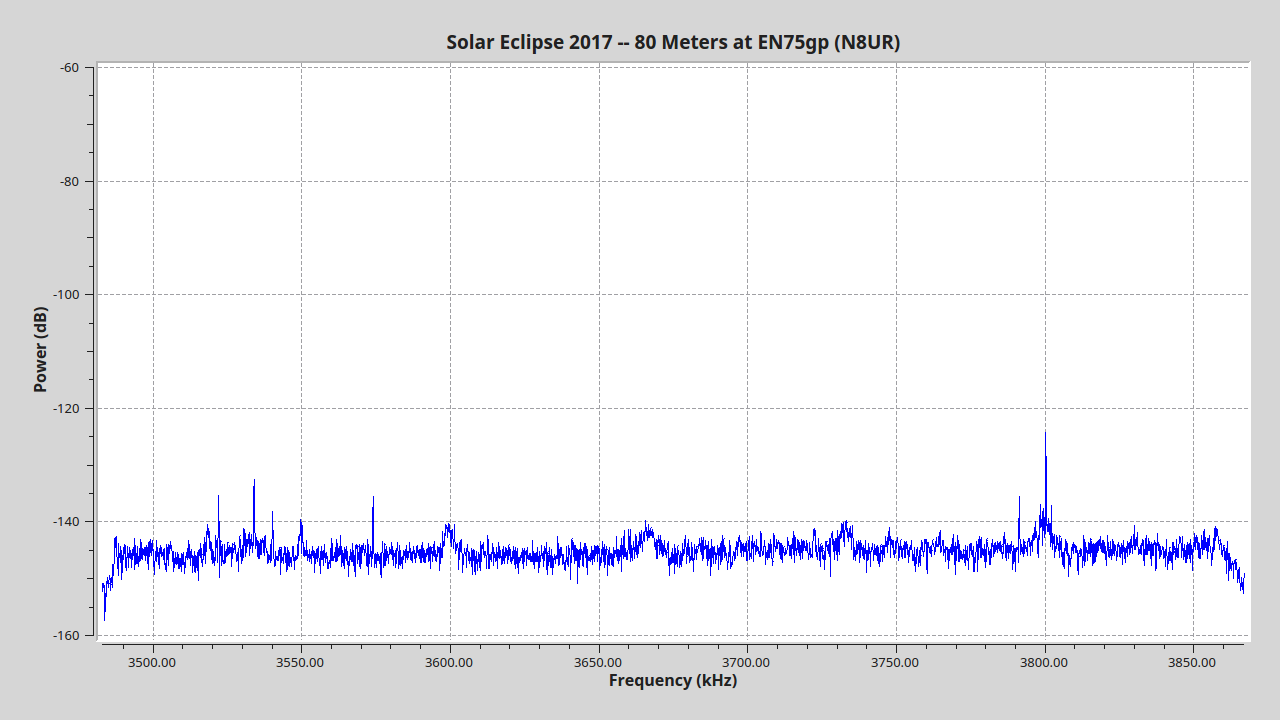
I haven’t had time to review these in any detail, but there’s a noticeable increase in activity on at least the 80 meter recording at around the time of the eclipse. I suspect there are some very interesting findings in this data, and I’ll be doing much more analysis.
The hardware used to create the recordings was an HPSDR “Hermes” software defined radio with a 43 foot vertical antenna. The radio’s amplitude response (reported signal strength at the antenna terminal in dBm) has been characterized and the results are well within 1.0 dB. The radio’s frequency reference was an FTS-4100 cesium standard that’s known to be within 1-12 of the correct frequency. The very accurate and stable frequency reference means that we can extract frequency, as well as amplitude, data from this data.
A Gnuradio script using the gr-hpsdr module written by Tom McDermott, N5EG, recorded IQ data from the Hermes receiver during the eclipse, extracting four “virtual” receivers tuned to respectively to the 80M, 40M, 30M, and 20M ham bands, each at 384 ksamples/second. The data was saved in the HDF5 file format using Gnuradio blocks from the MIT Haystack Observatory Digital RF package.
To make these movies, I played back the data (about 90 GB per virtual receiver) using another Gnuradio script, and took a screenshot of the FFT (spectrum analyzer) display every 5 seconds. I converted the ~5800 shots from each band into an MP4 movie at 30 frames per second. The result is a time-lapse video about 3 minutes long showing activity on that band over the 8 hour period.
The flowgraphs used both for receiving and playback, and several shell scripts I wrote to handle the screenshots and mp4 generation, are available in the “eclipse2017_playback” and “hpsdr_multirx” repositories at https://github.com/TAPR. I’m happy to share the raw data, but you’ll need to send me a 1 TB disk!