One of my Gnuradio projects is a tool that records IQ data covering 375 kHz — which is enough to capture an entire HF ham band (except for 80/75M). A neat trick is to retransmit such a recording to allow local receivers to tune in The Signals From The Past (of course, with very low power and tiny antenna so as to prevent interference). For example, I can take a recording of 14.000 – 14.350 MHz and play it back from 29.000 to 29.350 MHz. I use an Ettus USRP-1 to do this; it’s capable of about 0 dBm output.
If you think of the 275 kHz wide recording as a single waveform, it’s interestingly complicated. All sorts of signals of various amplitudes and frequencies appear and disappear, their phase vectors adding and subtracting. Such a waveform can have a very high peak-to-average power ratio. I decided to do some tests to see how much head-room is necessary to avoid distortion.
I played back the recording with the USRP feeding a spectrum analyzer through a 20dB pad. I can adjust the level of the digital stream, and I can also inject a single CW tone at the center of the band. Here is a screenshot of three conditions captured using the “max hold” trace function:
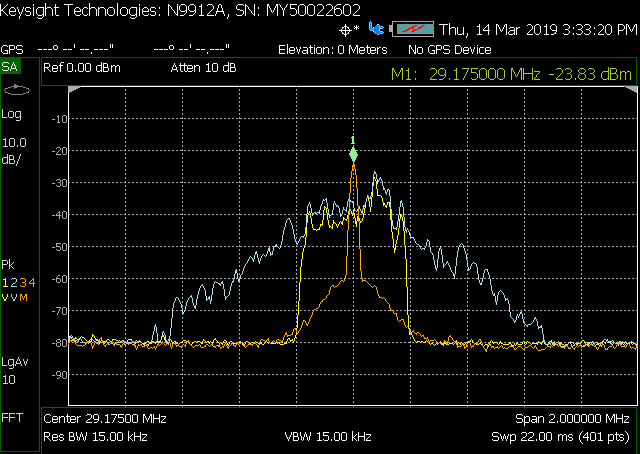
The orange trace shows the maximum power CW signal by itself — about -3 dBm. The “pedestal” at the bottom of the screen might include some distortion products, or might just be phase noise. If I deliberately overdrove the CW level, I got a very wide response that doesn’t appear here, so I think this is below the clipping level.
The yellow trace shows the playback with a gain value of 200. It’s very clean with no distortion. There’s enough headroom for the maximum instantaneous signal to avoid clipping.
The blue trace shows what happens when the gain is increased to 300 — clipping occurs and the occupied spectrum increases tremendously, though only for an instant at a time. The max hold function captures this; a real time spectrum analyzer would do a better job.
The spectrum analyzer can also do channel power measurements. This capture shows the occupied bandwidth, and power within that bandwidth, of the unclipped waveform:
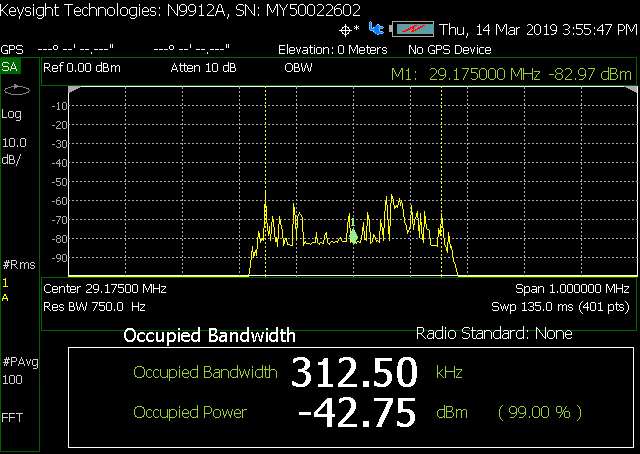
Apparently no one is at the extreme top or bottom of the band, as the 99% bandwidth is 312 kHz (I’ve seen it show up to 350 kHz). The average power in that bandwidth is -22.75 dBm (remember, there’s a 20 dB pad). Assuming that there’s not much room to increase the drive before clipping sets in, that means there’s about a 20 dB difference between the average clean power, and the maximum CW power.
Here’s what happened when I cranked the drive way up:
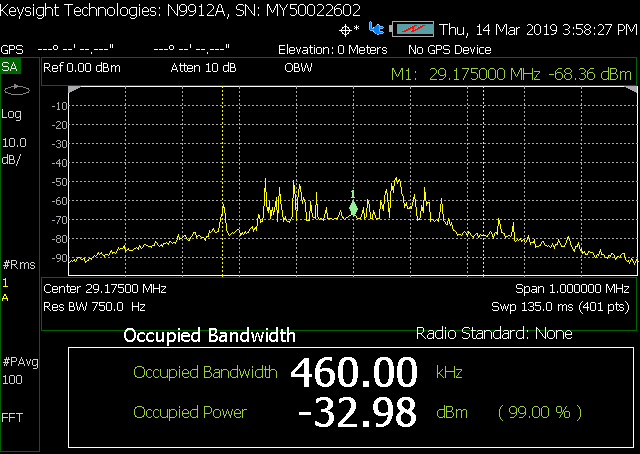
Average power is up by about 10 dB, but the occupied bandwidth has grown to 460 kHz. And if we could capture instantaneous values, it would be wider than that.
This is why it’s so important to use clean amplifiers with lots of headroom for video and complex digital waveforms.